17 Using Visuals to Enhance Documents
It’s Not Just About Making it Look Good
Incorporating some sort of visual element can make a plain document look better, more interesting, or less plain. For example…

Here, an image of a student struggling to choose which image to add to her report on sales trends in the sneaker industry, adds to the text and demonstrates a concept. You could argue that using this image enhances the text, at least a little.
But then there’s this…

Even though we can all probably agree that ninjas make everything better (if you disagree, you’re wrong) and the ‘life or death’ stakes of the image makes it more dramatic, it also takes it off message. This image doesn’t enhance the text; it distracts from it.
Using visuals in your professional/technical documents isn’t about making them look better for the sake of looking better. In these kinds of documents, visuals need to serve a purpose and enhance the audience experience in some way.
Common Types
There are many different kinds of visuals that are used within professional/technical documents but these are the most common types that you will likely find yourself using:
- Graphs
- Charts
- Tables
- Photos
- Diagrams
The first three are especially common – and useful – in any sort of document involving data and that’s a perfect example of how visuals can enhance a document. If you (or your audience) are at all like me, then you have difficulty grasping numbers and numerical content. This is where a well designed visual can be extremely useful and extremely user friendly.
Let’s look at an example. Consider this paragraph on the sales trends for men’s running shoes over the past five years…
In the realm of athletic footwear, the sales performance of men’s running shoes over the quinquennium preceding this analysis (covering the period roughly from five years ago to the present) displays a nuanced tapestry of fluctuation, characterized by disparate growth rates within distinct market tranches. Total global gross merchandise value (GMV) within the sector experienced an initial uptick, expanding by approximately 8.72% in year two relative to year one, before correcting sharply in year three with a contraction of 4.31%. This was followed by a subsequent, albeit more muted, recovery, registering a compound annual growth rate (CAGR) of roughly 2.15% over the final two-year interval. When segmented by price point, however, a critical divergence emerges. While the low-tier market (sub-$75 MSRP) remained relatively static, the ultra-premium category (above $160 MSRP) saw a dramatic, non-linear surge of 23.4% in unit volume in year four alone, before settling into a more sustainable expansion of 9.1% in year five. Conversely, the mid-tier segment ($75-$130 MSRP)—traditionally the volume leader—saw its market share erode by a notable 12.8 percentage points in total value over the entire five-year span, falling from an estimated 61.2% to 48.4%. This shift suggests a bifurcation of the consumer base, driven perhaps by a combination of increasing brand loyalty at higher price points and the proliferation of discount alternatives. Additionally, the digital-native direct-to-consumer (DTC) channel saw an exponential, albeit accelerating, CAGR of 15.9%, contrasting with a more pedestrian 3.2% CAGR for traditional brick-and-mortar retail, leading to a profound shift in channel mix from a 78:22 split in year one to a more balanced 62:38 by the conclusion of year five.
You all totally understood that, right? I’m sure some of you did, but I’m also sure that some of you found yourself completely lost – and possibly tuning out – the moment the numbers came in. But what if that same info was presented with a graph?
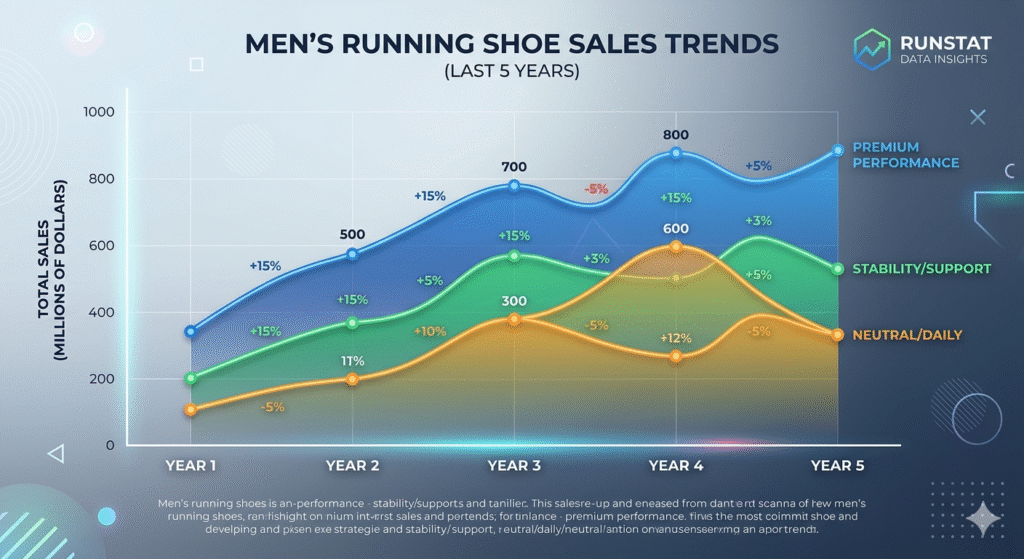
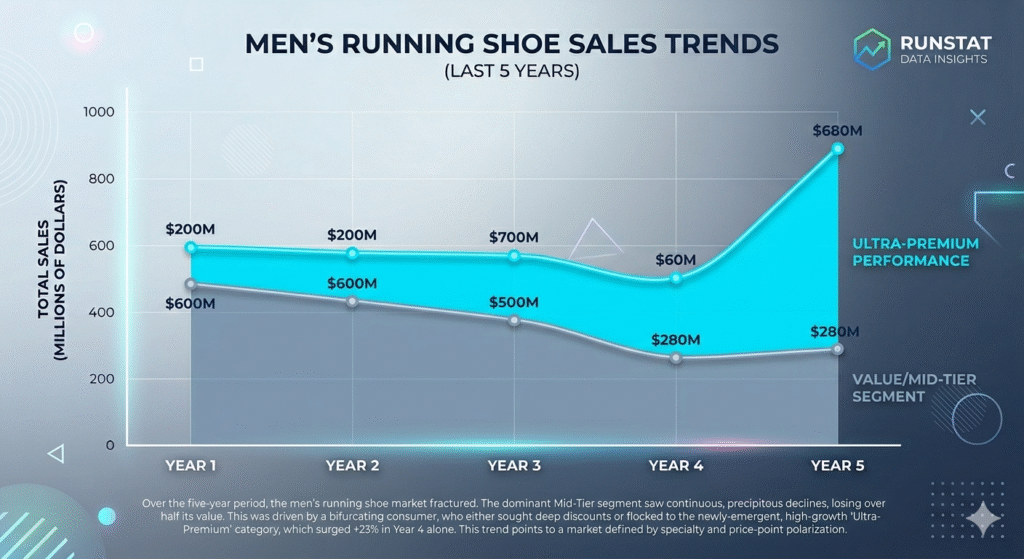
Even if you’re not in the business of selling men’s running shoes or interpreting sales data about them, the graphs still make the data a bit simpler to understand and also makes the overall trends clearer. Someone who is in that field would definitely have a better understanding after looking at those two visuals.
That’s the reason why, as a writer, you would want to include visuals in your documents. They can help your audience understand your points in a better/different way and can clarify points that might be somewhat confusing when written out.
The most important thing to remember about using visuals is this: they need to be in the document for a reason. They need to be connected to the words (and not used in place of them) and not there simply for decoration. A well chosen and designed visual can add depth, clarity, and authority to your written documents, so use them wisely.
